I built a family tree for every sampled record in one evening, by describing it. Then I spent a week learning that the hard part of a website isn't the website. It's the robots.
01The idea
At 15, Endtroducing rewired my ears. DJ Shadow built that record almost entirely out of other records, and once you know that, you can't unhear it. Every sampled record is a door into another one. Behind the door is a drum break from 1969, a soul B-side, a film score nobody bought.
I've always wanted to follow that chain properly. Pick a record, see what it borrowed, see who borrowed from it, and keep going until it's 2am and you're listening to a library record from a Swedish bank advert.
The obvious place for that is WhoSampled. It has no public API, and its terms ban scraping, so it was out. Genius, it turned out, has the same kind of data and does let you ask for it.
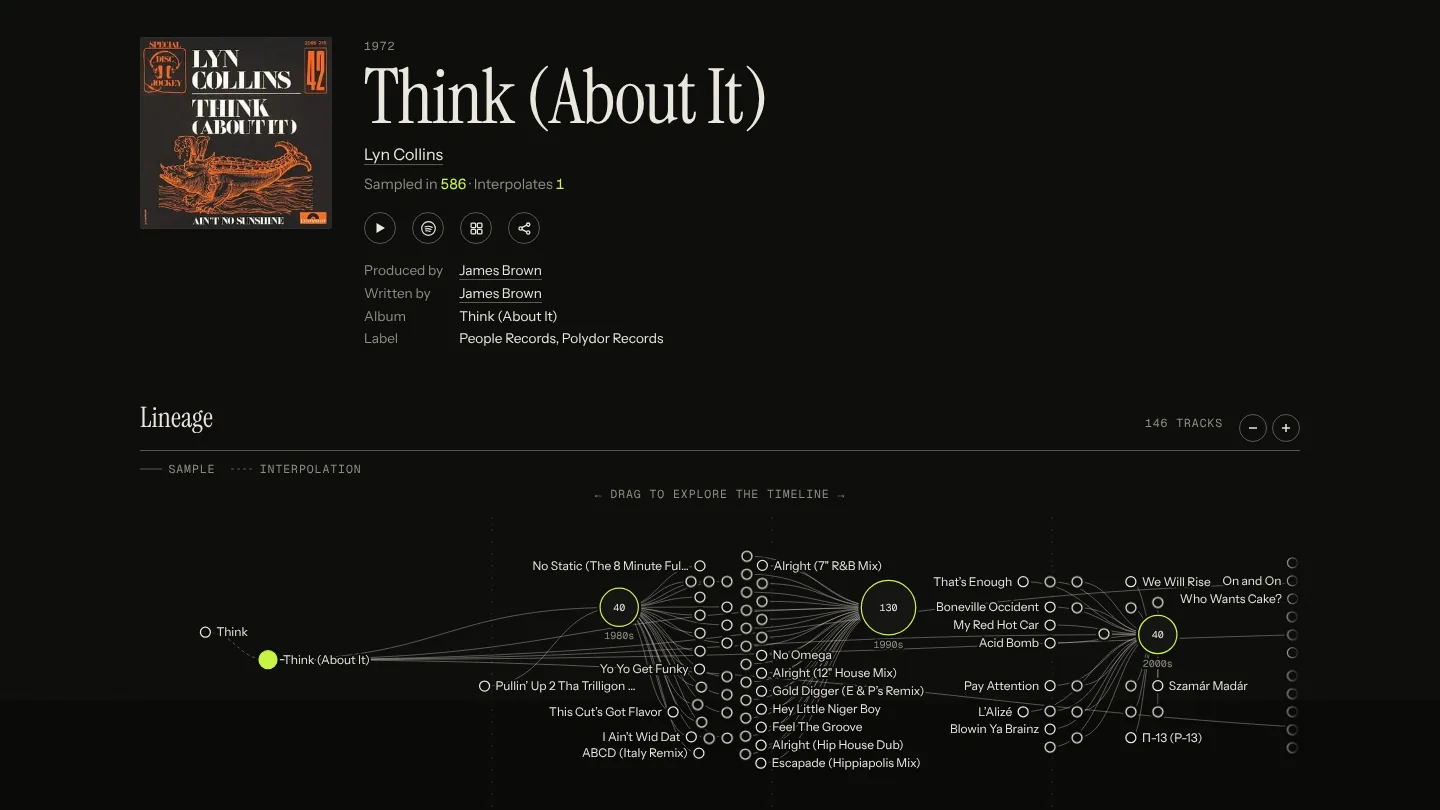
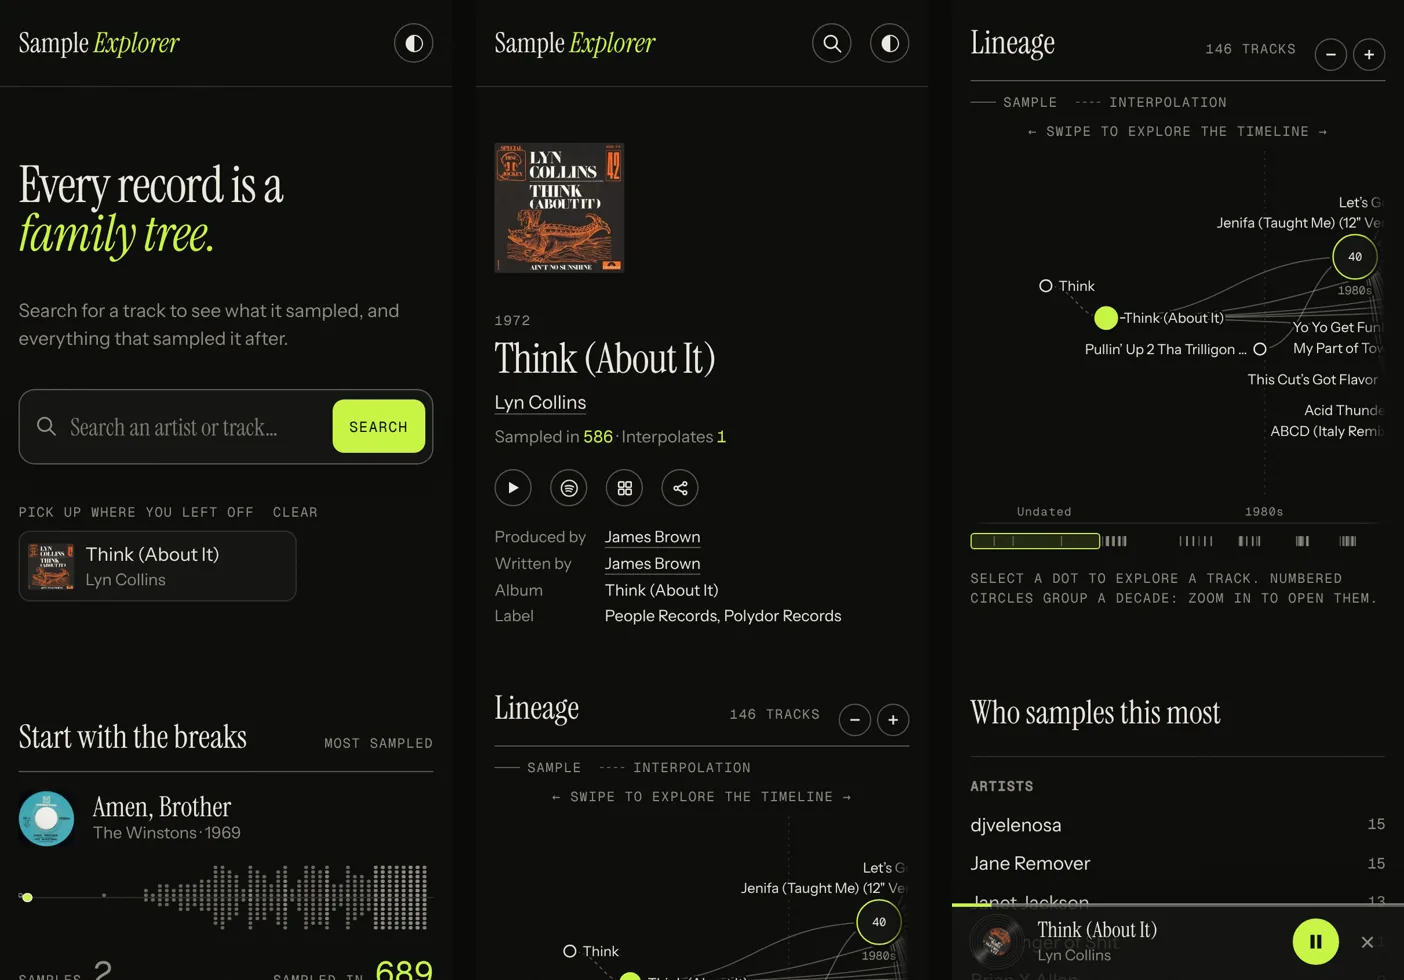
Sample Explorer is the result. Search any record and see what it sampled and what sampled it. Follow the chain as a graph where left to right is time. Press play on any of it.
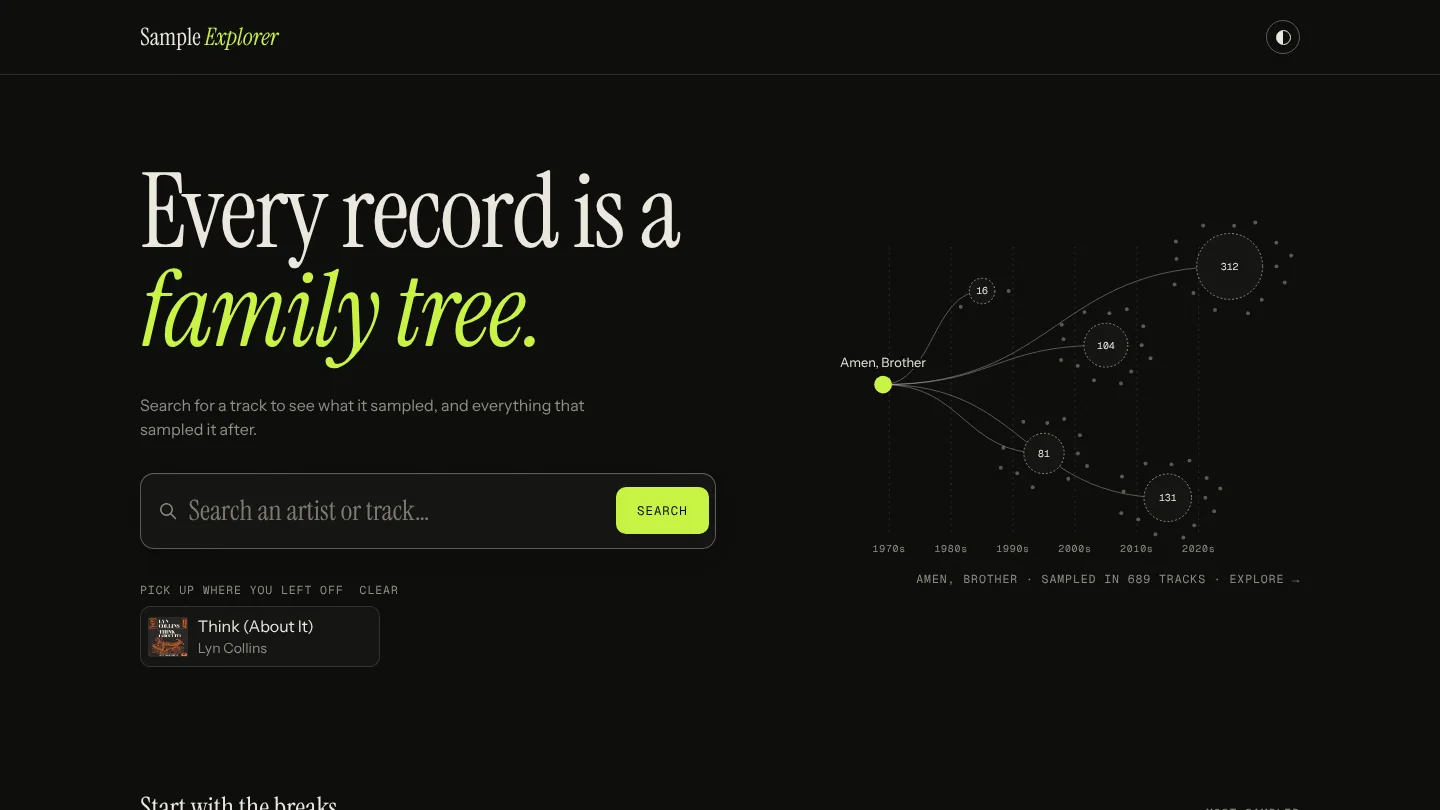 Home
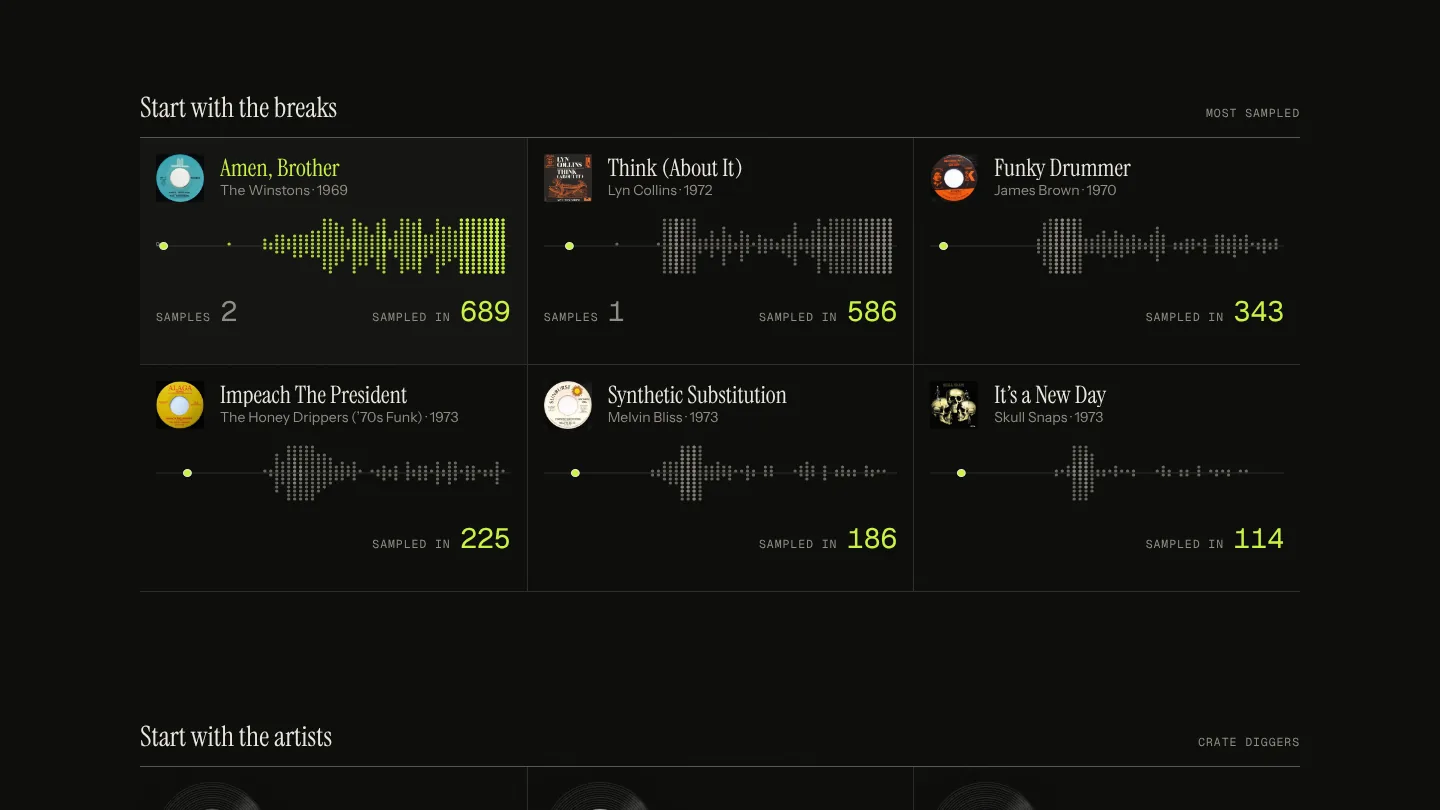 Start with the breaks
02Check the crates first
I didn't start with a design. I started with the question every designer should ask before drawing anything: does the stuff we need actually exist?
So the plan began with a "data spike": half a day to check whether Genius really knows who sampled what, before building a single screen. Ten well-known records, three sources asked about each.
| Record | Genius: sampled in | MusicBrainz: sampled by | 30s preview |
|---|---|---|---|
| Amen, Brother | 683 | 50 | ✓ |
| Think (About It) | 577 | 0 | ✓ |
| Funky Drummer | 338 | 8 | ✓ |
| Apache | 76 | 0 | ✓ |
| Ain't No Half-Steppin' | 73 | 3 | ✓ |
Genius won by a distance, and the spike said "go" the same day. It also handed me the design problem for free: Amen, Brother has 683 records hanging off it. You can't draw 683 lines and call it an interface. Whatever I built had to fold, group and reveal.
That's research, just faster. Half a day of checking saved me from designing something beautiful on data that wasn't there.
03What got built
The first evening was the product. The next ten days were the polish, and then a week of fighting robots (more on that later). Here's the tally.
| What | How much |
|---|---|
| First evening | 21 commits in under three hours: search, track pages, the graph, previews, share images, artist pages, dark and light themes, and a player that keeps playing between pages |
| Code written | About 9,900 lines |
| Starting points on the homepage | 7 breaks hip-hop was built on, and 12 artists |
| Producers credited | 1,198 records that sampled the homepage breaks |
| Ideas I killed | 3, one of them a whole second version of the site |
What you can do with it:
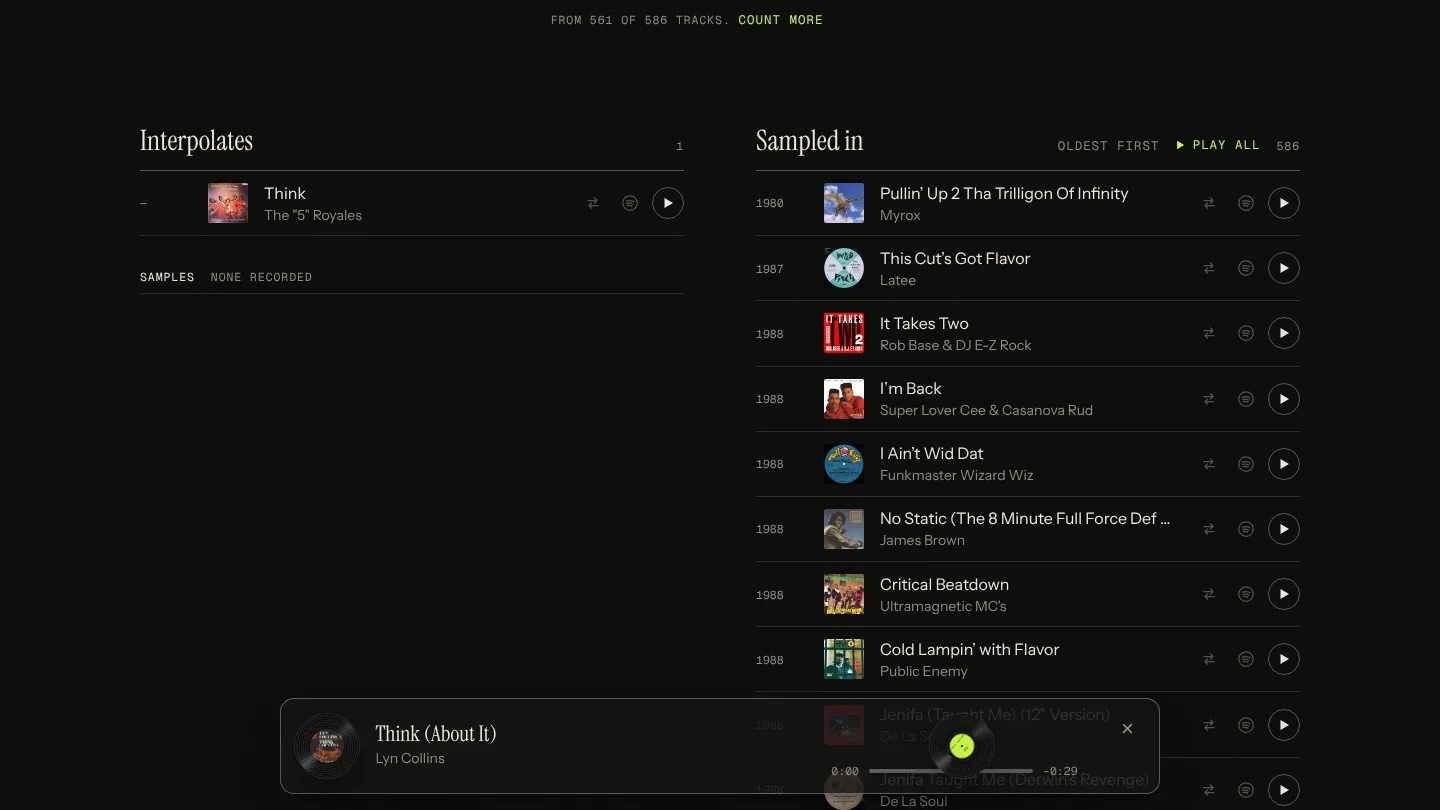
- Search any record and get two lists: what it sampled, and what sampled it. Fan edits and mashups are hidden unless you ask for them.
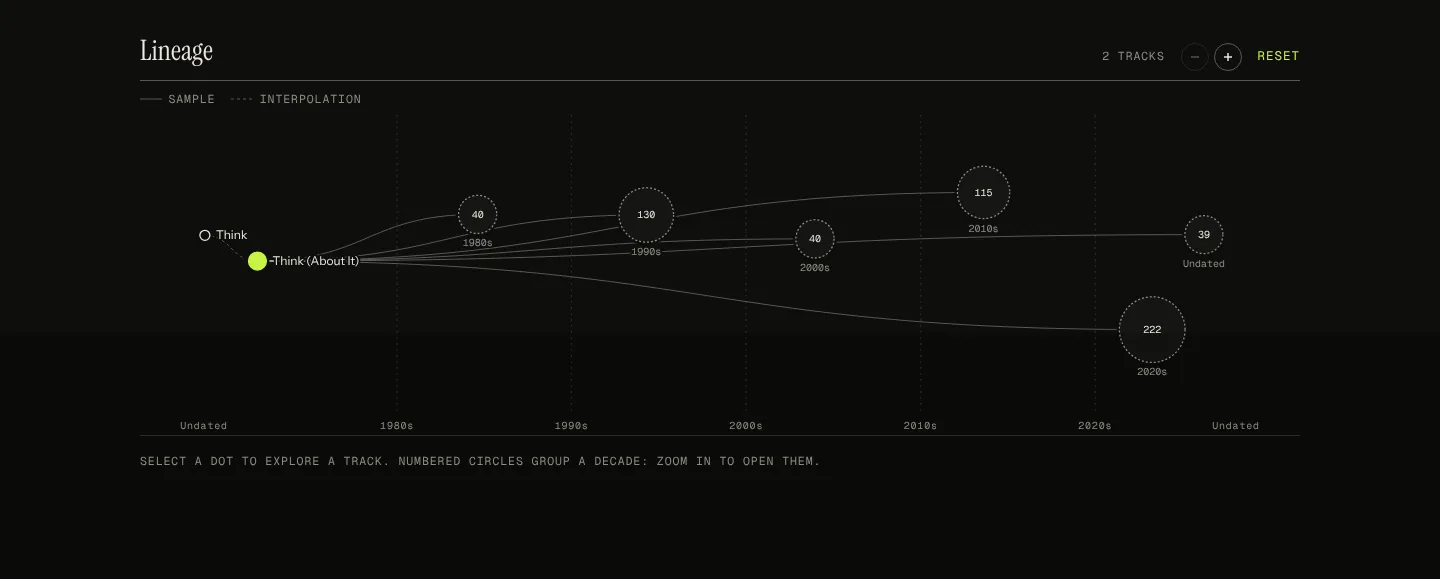
- Follow the graph. Time runs left to right. Tap a record to play it, open its connections, and keep going. Zoom in and the decade groups open up; zoom out and they fold away.
- Listen as you go. Every record has a 30-second preview, and the player keeps going while you browse. Play a whole list as a queue, and on a phone, swipe the title to skip.
- Connect two artists. Pick any two and it finds a chain of samples between them. The Jackson 5 to Taylor Swift is a good one.
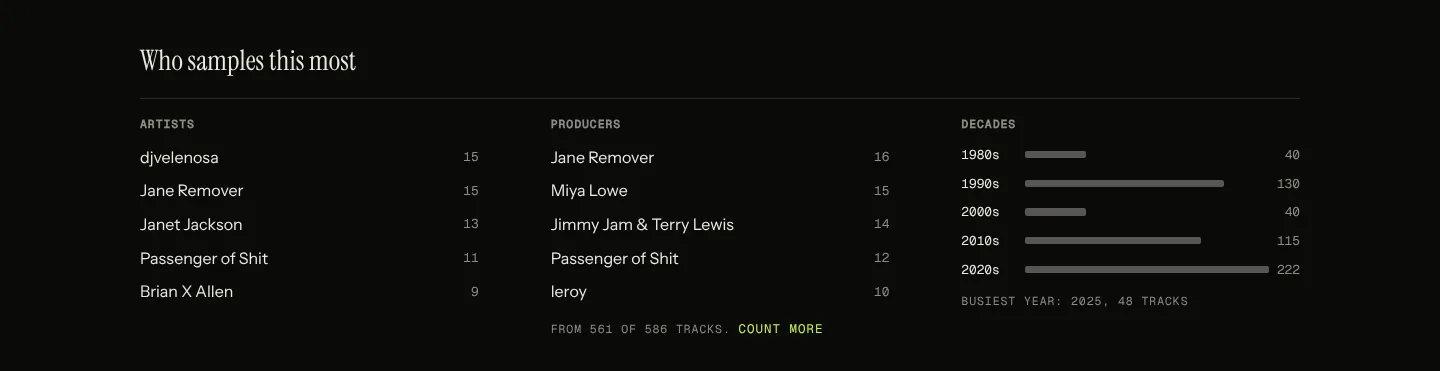
- Who samples this most: the artists, producers and decades that keep coming back to a record.
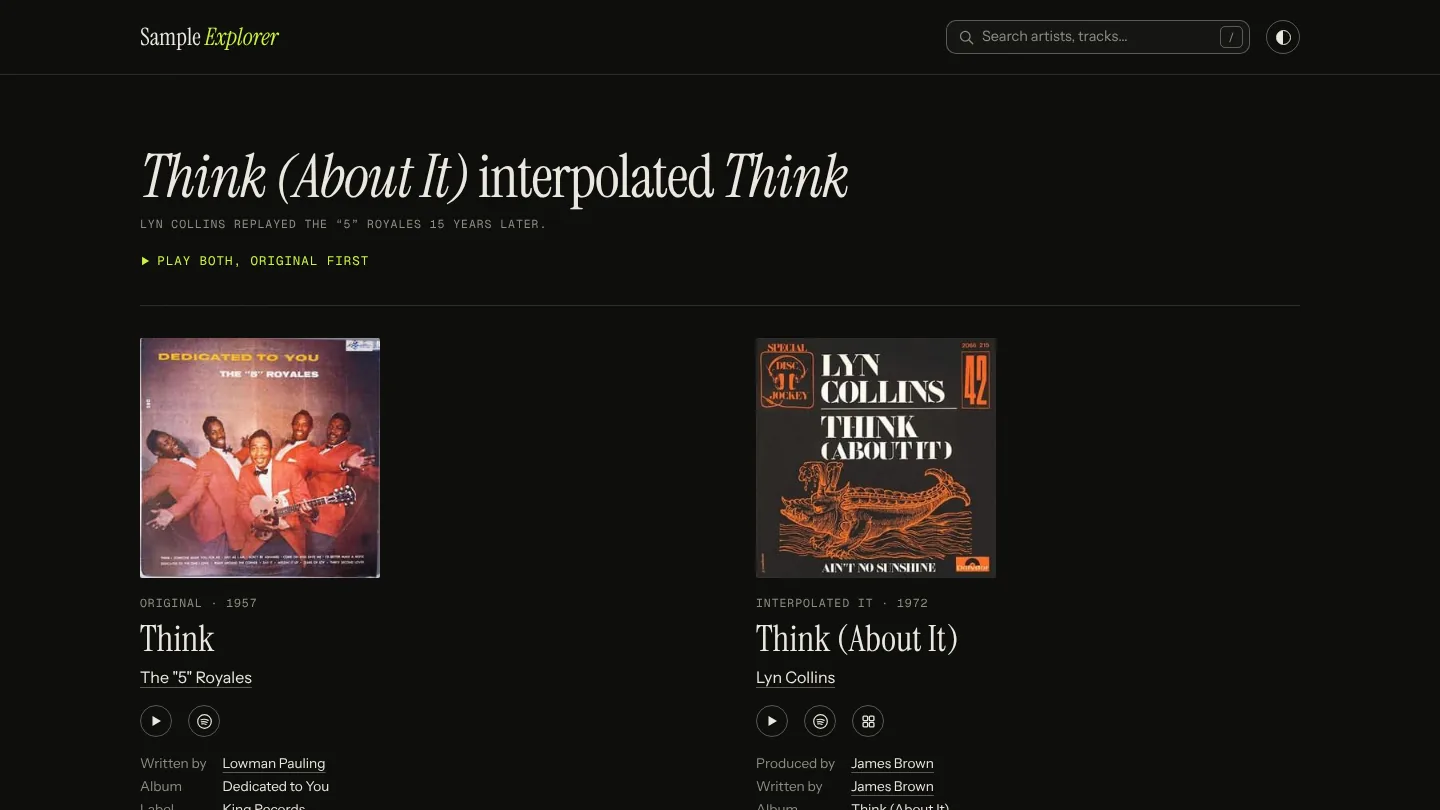
- Compare an original and the record that sampled it, side by side, and chop it: one tap sends the sample to YPC, a pad sampler for YouTube, with sixteen pads ready to play.
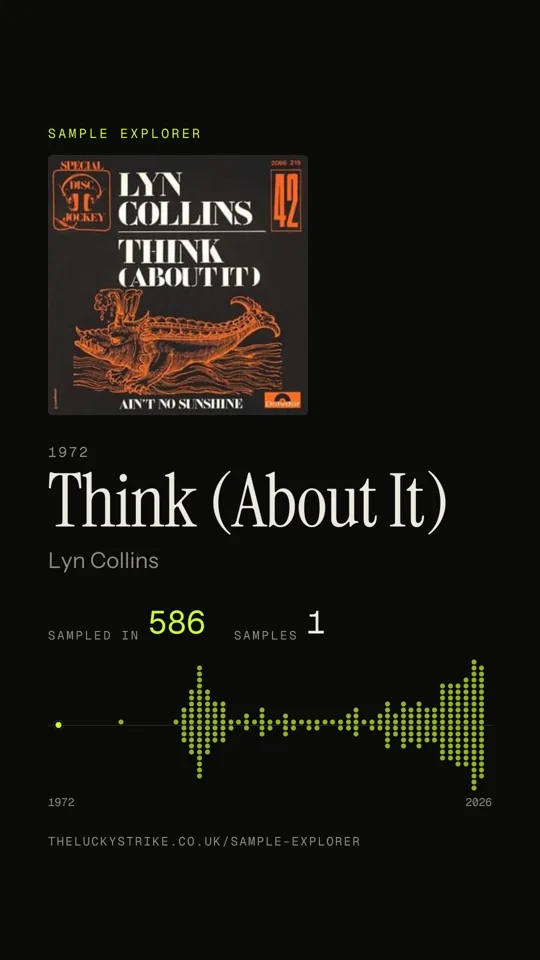
- Share a story card straight to Instagram, with the record's lineage drawn as a strip of dots.
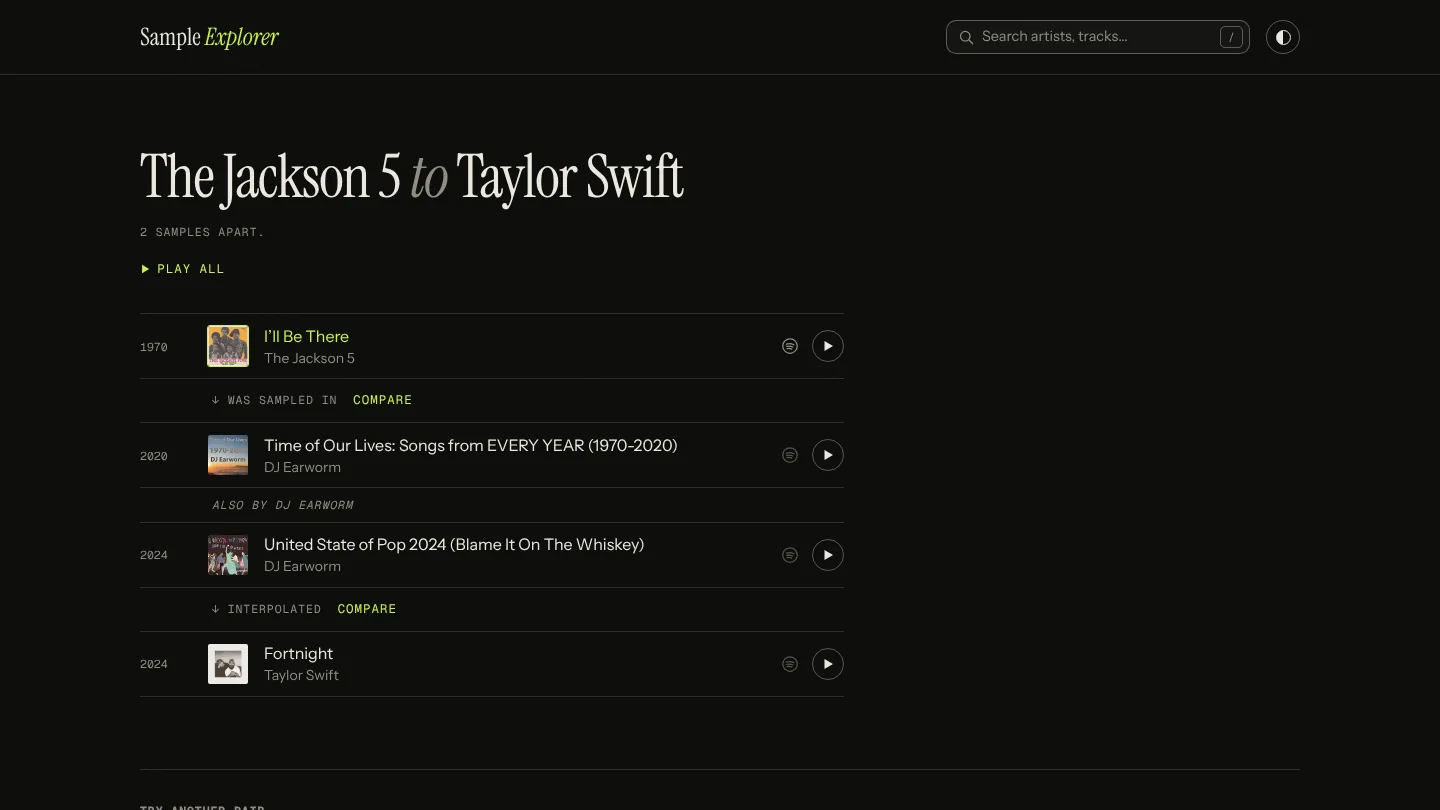 Connect
 Compare
 Play
04How it works
If you're a designer, read the plain-English bit of each step and skip the code. If you build things, the code is there for you.
1. Genius is the record shop
Every record page asks Genius one question: what does this song sample, and what samples it? Genius answers with a list, and the page sorts it oldest first so it reads like a timeline.
Genius takes up to ten seconds to answer for a heavily sampled record, and it only lets you ask 10,000 questions a day. So every answer is remembered. The second person to open Think (About It) gets it instantly, and costs nothing. That turned out to matter far more than I expected. Hold that thought.
2. A graph where left to right is time
Most network graphs are a hairball: dots pushed around until they stop moving. That tells you what's connected, but not when. In music, when is the whole story.
So every dot is pinned to its release year. The physics only gets to move dots up and down, never sideways. The result reads like a family tree on its side: originals on the left, the records that borrowed from them spreading out to the right.
// every dot is pulled hard toward its release year; only y is free to settle
simulation
  .force("x", forceX((d) => d.targetX).strength(1))
  .force("y", forceY((d) => d.targetY).strength(0.25))
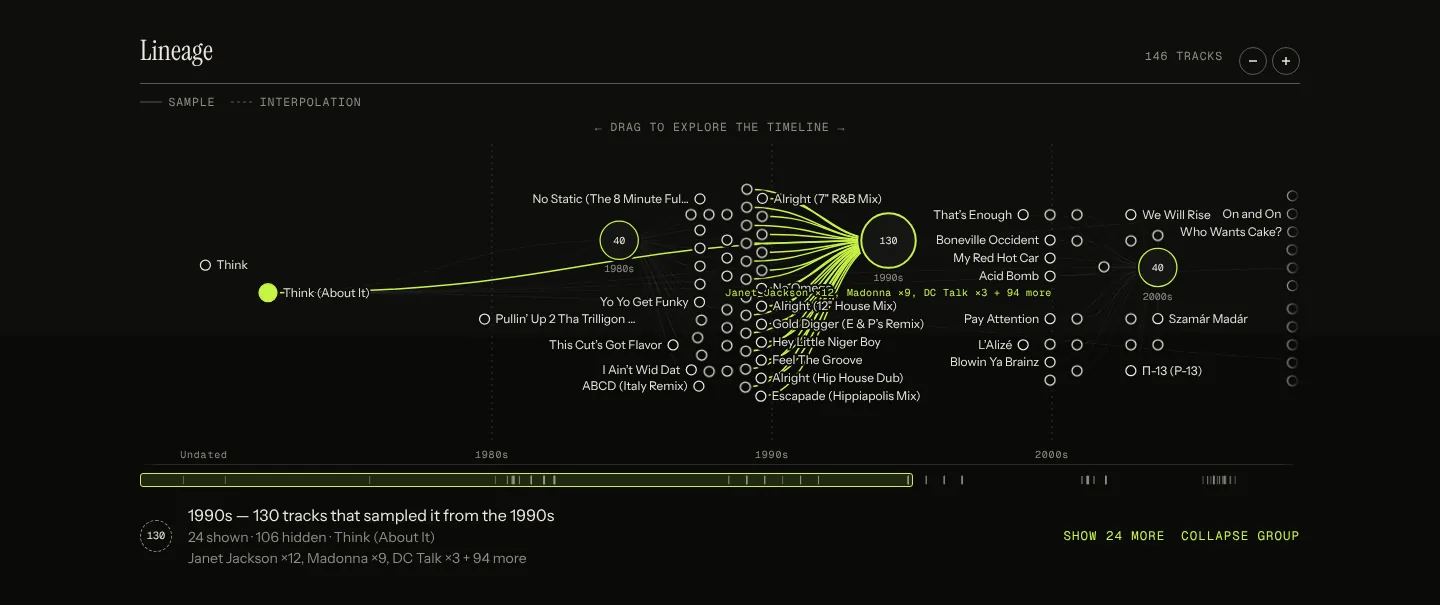
Then there's the 683 problem from the spike. Up to 16 records on a side are shown one by one. Past that, they fold into decade groups: a circle for the 1990s, one for the 2000s. Zoom in and the groups open; zoom out and they close. Open one and every other line fades back, so you can see which records you just let in.
 Zoomed out
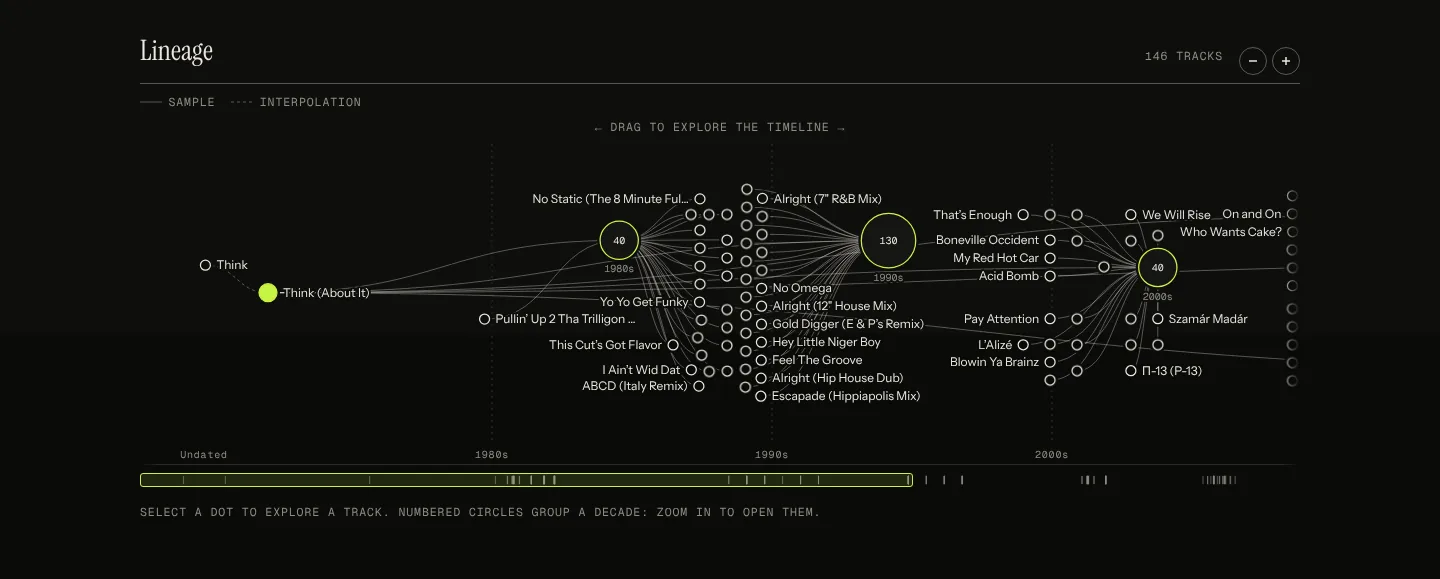 Start
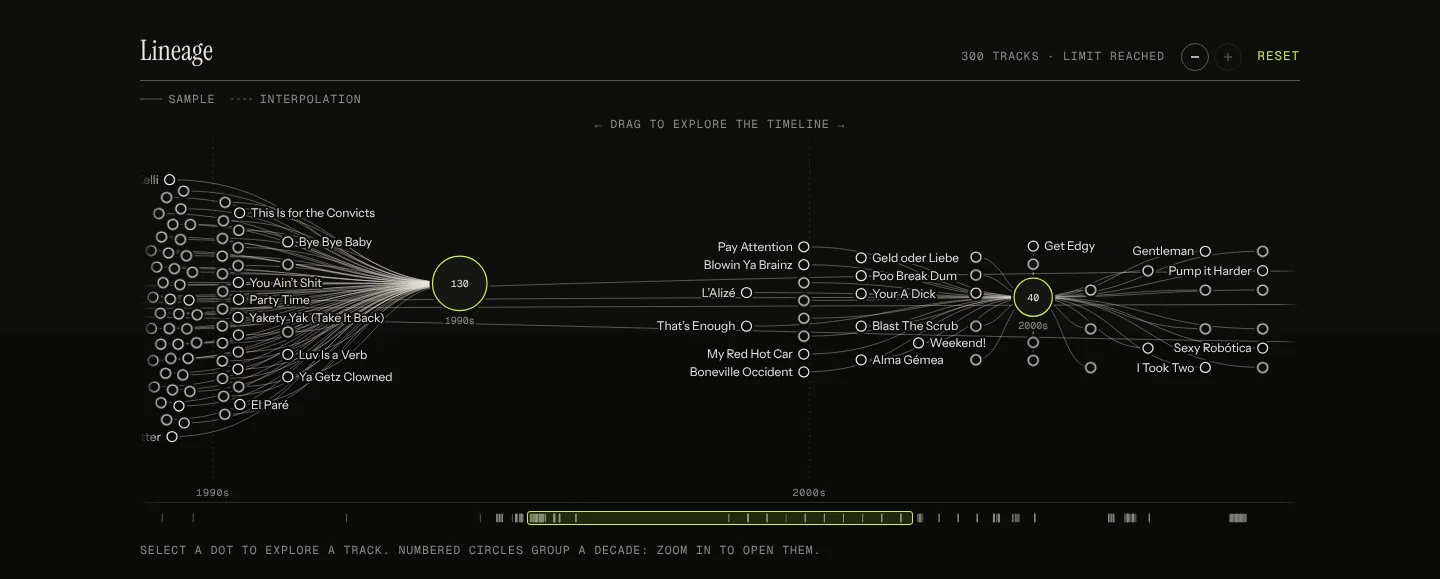 Zoomed in
3. Every record plays
Each record gets a 30-second preview from Deezer, matched by artist and title. The audio never passes through my site: the page asks Deezer where the clip is and sends your browser straight there. That keeps it fast and keeps the audio off my bandwidth bill.
The player lives at the bottom of the screen and keeps playing as you move between pages. Tap a dot in the graph and it plays. Press play on a list and the whole list becomes a queue.
4. Everything else
- The site: Next.js on Vercel, served at theluckystrike.co.uk/sample-explorer through the same kind of rewrite as the rest of my side projects. Same fonts, same ink-and-acid colours as this site.
- Connect two artists: a search through the web of samples for a chain between two names. Big pairs take longer than a web page is allowed to, so the search runs in 12-second slices, carrying on where the last one stopped.
- Who samples this most: Genius lists samplers by title and year only, so producer credits cost an extra question per record. The homepage breaks' 1,198 samplers were counted once, in advance.
- Share cards: every record gets its own share image, drawn on the fly with the record's lineage as a strip of dots.
05How I prompted
Same as last time: these are my real messages, typos and all. Most of the later ones were typed on my phone. I didn't write a clever prompt. I wrote the way I'd talk to a designer sitting next to me.
Describe the behaviour, not the build
Add zooming to the graph: When zooming in to the lineage graph expand the groups and when zooming out close then again
When tapping or clicking on a node in the graph, auto play that song
Two sentences, two features. I said what should happen when someone does something. How zoom levels map to decade groups was Claude's problem.
Name the worry before it's a bug
When a group has been opened, is there a way to differentiate between the lines of the open group and the rest? The problem I foresee is that in the heavily sampled tracks there are SO many lines that it becomes heavy and fiddly
Claude came back with two options. I said "Yes build both". Groups now fan out from their circle, and focusing one fades every other line. Spotting the problem was my job. Solving it was a two-minute conversation.
Ask for a list, then edit it
Any more visual improvements to the graph? For readability and discovery
Do them all apart from 5
That's a design review in two lines. Claude did the thinking out loud, I did the editing. Visited rings, halos and a position strip went in. Number five didn't, and the reason why is the best part of this whole story.
Admit when you got it wrong
Swipe left = previous track
Swipe right = next track
Sorry that's wrong; left = next and right = previous
Same minute. It's cheaper to say "sorry, I got that backwards" than to live with it. Nobody sulked.
Kill things fast
Three ideas died, and I'm proud of all three deaths.
Remove the v2 completely, it's dull in comparison
I'd asked for a whole second version of the site on Meta's Astryx design system, side by side with the original. It took about a quarter of an hour to build and one look the next morning to bin. It was tidy, consistent and completely forgettable. Worth seeing, so I knew.
this is terrible, let's not do this
delete it
That was a prototype of the graph as a race track: you drive towards the future over the horizon. Before building it I asked for the UX pitfalls, which was smart. Then I went ahead anyway, which was not. It was terrible. It took two messages to get rid of.
The third was number five, which we'll get to.
Ask for a sense check, not a yes
I think the target symbol in the player might be overkill now. Thoughts ?
Claude agreed and said why. I said "yes remove it". Sometimes you just want a second pair of eyes before you delete something.
Report it like a user
urls like this are broken
Followed by a link: the Jackson 5 to Taylor Swift. No diagnosis, no theory. The cause was that the first search for a big pair ran longer than a web page is allowed to, so the page died before it answered. Now it searches in slices and shows "Still digging" while it works.
06What broke
The usual suspects. None needed me to understand the cause, only to notice it.
| What I saw | What was actually wrong | The fix |
|---|---|---|
| "Link copied" was hidden on phones | The phone's share sheet slid up over it | Moved the message to the top of the screen |
| Zooming the graph was "very janky" | Every zoom re-ran the physics for up to two-thirds of a second, and the scroll started before the dots moved | Dropped a force the time axis didn't need, and made the view glide with the dots |
| Long track names were cut off in the player | Not enough room next to the controls | Scrolling titles on phones; on desktop, controls moved right so the title gets the space |
| Connect pages for big pairs died | The first search took longer than a page is allowed to run | Search in 12-second slices and carry on |
| Search stopped working, pages errored | Robots. A lot of robots | See below. It took a week |
07The 10,000 problem
This is the bit I didn't see coming, and the bit I learned the most from.
Genius lets you ask 10,000 questions a day. Remember, every answer is kept, so that sounded like loads for a side project with a few visitors. Then search started failing and pages showed errors. So I sent this:
the limit still seems to be hit frequently with small usage, we need to fix this
When we dug in, Genius had counted 44,708 questions in a single day. My analytics showed a handful of people. Something didn't add up, and finding it was four layers deep.
Layer 1: the site was being helpful
Websites quietly load the pages behind the links you can see, so the next click feels instant. On most sites that's free. On mine, loading a record page meant asking Genius about it. So one person opening one record also asked about every record listed on it, like a waiter bringing every dish on the menu just in case.
Claude proved it with a fake version of Genius that counted questions. One page view: 21 questions. Fixed, it was one.
Layer 2: the memory had amnesia
Remember the remembering? It turned out the built-in memory empties every time the site is updated, and can drop things whenever it likes. So every deploy started from scratch. The fix was a proper store, Upstash, that keeps every answer for months, whatever happens to the site. It took me two minutes to switch on, from my phone, once I found the right menu.
Layer 3: the limit never lifted
Genius counts refused questions too, over a rolling 24 hours. Each copy of my site stopped asking only after it was personally refused, and there were lots of copies. So the count never fell, and the site never recovered. Now one refusal stops every copy at once, until the time Genius says to come back.
Then I added a usage page so we could finally see real numbers. When the block lifted that evening, 9,999 questions went through in under three hours. About one a second. That wasn't people.
Layer 4: the robots
With a counter on the door, the culprits introduced themselves.
| Who | Pages in a day | What we did |
|---|---|---|
| AI and SEO crawlers | Not counted: they came in through a side door my robots.txt didn't cover | Turned away at every door |
| Unnamed bots | 9,614 | Turned away at the door |
| Bing (Google barely showed up) | 700 to 1,300, and it would happily crawl forever | Welcome, with a daily allowance of 1,000 questions |
| "Browsers" | 6,512, while the site was down | A browser check, below |
The last row was the clever one. A scraper was posing as ordinary visitors: one from Germany, one from Spain, one from Peru, each on a different network, each running a browser a couple of years out of date. You can't block that by name or by address.
So the first page anyone loads now runs one line of JavaScript that sets a cookie and reloads. A real browser does it in a blink, and you'll never notice. A script that only downloads pages never gets past it.
// a page that's already stored costs nothing; anything new spends today's allowance
if (await redis.exists(storedKey)) return true;
return (await bump("visits", ["bot-budget"], cost)) <= BOT_BUDGET;And number five? It was producer counts across the whole graph. Lovely idea, but Genius only gives producers one record at a time, so every page would have cost dozens of extra questions. I said "Let's not build it then", a full two weeks before I understood how right that was. It came back later in a cheaper form: counted once, in advance, for the homepage breaks, and only on request everywhere else.
I couldn't have diagnosed any of this myself. But every layer started with me noticing something felt off and saying so in a sentence. "Small usage" was the clue. The rest was Claude counting.
08What I took from it
The Listening Room taught me that taste is the bottleneck. This one added a few things.
Research still comes first. Half a day checking the data shaped every decision after it. The 683 records behind Amen, Brother designed the graph before I did.
The first evening is the easy bit. A working product took one evening. Making it survive contact with the internet took longer than building it. If you ship things, budget for that. Nobody shows you the week after.
Measure before you guess. I spent days guessing at the limit. The moment there was a counter, the answer took one look. In product terms: instrument it, then decide.
Saying no is a feature. The v2, the race track and number five all died, and the product is better for every one of them. Building things got cheap. Deciding what not to build didn't.
Your best prompt might be a symptom. "Very janky." "Urls like this are broken." "The limit still seems to be hit with small usage." I described what I saw and what I expected. That was always enough.
Go and pick a record. Follow it backwards to the break, or forwards to whoever borrowed it last. If it's 2am and you're listening to a Swedish library record, it's working.
A shout-out. Thanks to Umang in the WeTravel design team, whose feedback and ideas on the graph UI were genuinely valuable. I put them into practice, and the graph is better for it. The best crits still come from people.
Built with Claude Code. Sample data from Genius, previews from Deezer. Read the companion piece, The Listening Room.